Congressional districts choropleth
Code, Interactives, Mapping / Aug. 7, 2013
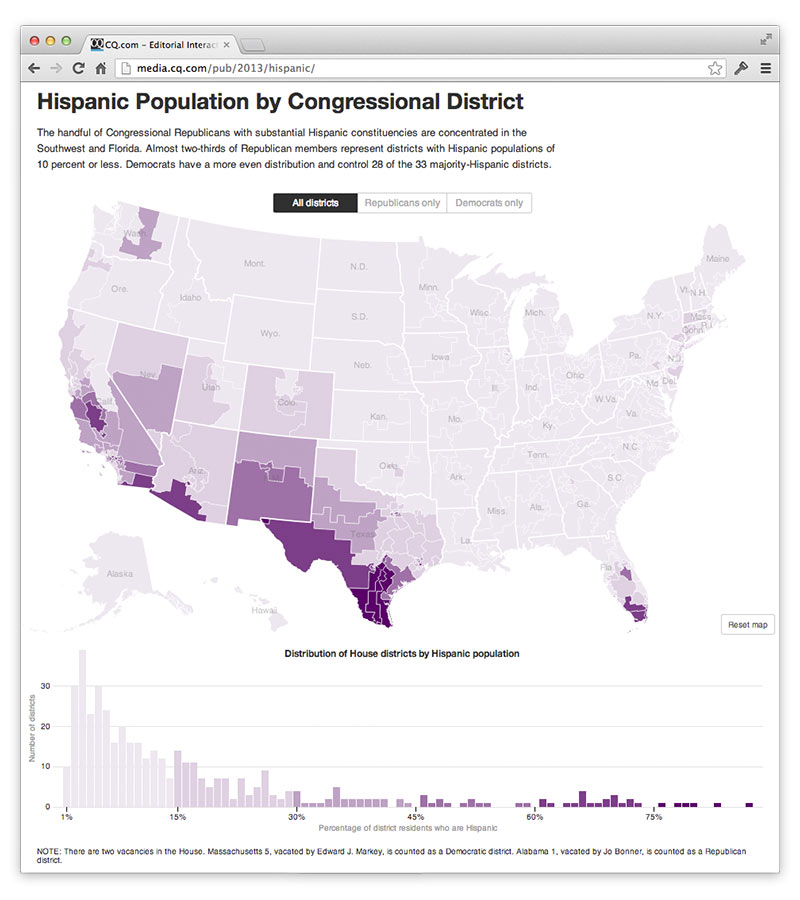
A d3.js map with constrained pan and zoom + bonus bars showing distribution + fun transitions limiting the view to Republican- or Democrat-controlled districts + hovers on the map give you the Rep’s name. A little overkill, perhaps, since there isn’t a strong editorial mission for this guy. The distribution bars were done for an immigration story in CQ Weekly to make the point that most Republicans in the House don’t have too much to fear from Hispanics in their home districts, and to name the few GOP outliers.
But 2014 election graphics are nigh, which means maps! So we attached this data to the beta version of our 113th House Congressional district map.
For this version, I trimmed the Census Bureau’s district shape file, which extends boundaries into lakes and oceans, to land boundaries using QGIS. Then I used TopoJSON to reduce the 110MB GeoJSON file down to around 300k, keeping only around 2.7% of the points. The result gives a acceptable detail scaled up to 5x. Sadly that isn’t enough resolution to make out Manhattan and some Los Angles districts, so I pushed the scale extent to 6 so that you can hover and find New York 10, even if simplification has made the island little more than a crooked rectangle. Another issue with the large scale factor is the state boundaries, which came from the National Atlas, don’t align perfectly to the district boundaries — the result of the simplification having different effects on the two GeoJSON files.
For the next version I’m going to try projected TopoJSON in hopes that it saves enough render time to put some more detail back in the map. Not sure what to do about the state boundaries other than edit the paths by hand in QGIS :-\