Roll Call Clout Index
Code / May. 5, 2013
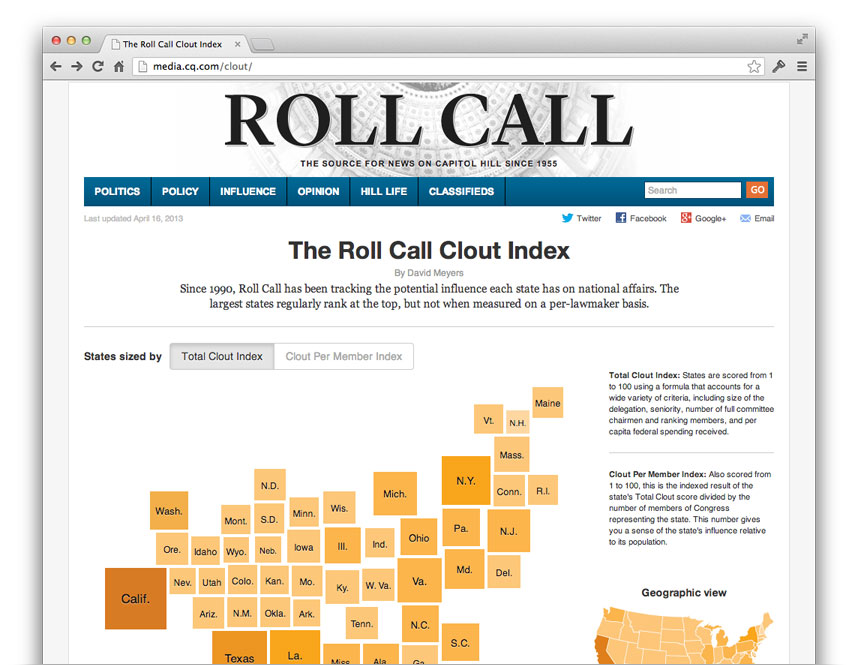
The Clout Index shows each state’s relative influence in Congress. The NYT’s electoral college graphic inspired the use of Demers cartograms, which worked out great because it’s easy to see in the transitions which states’ representatives have influence disproportionate to the number of people they represent.
The state boxes are simple divs so theIE people can at least see the cartogram, but alas, 50 animating divs results in choppy animation unless you’re using Chrome on computer with a good GPU.
See interactive on CQ Roll Call or my archived version with no external dependencies